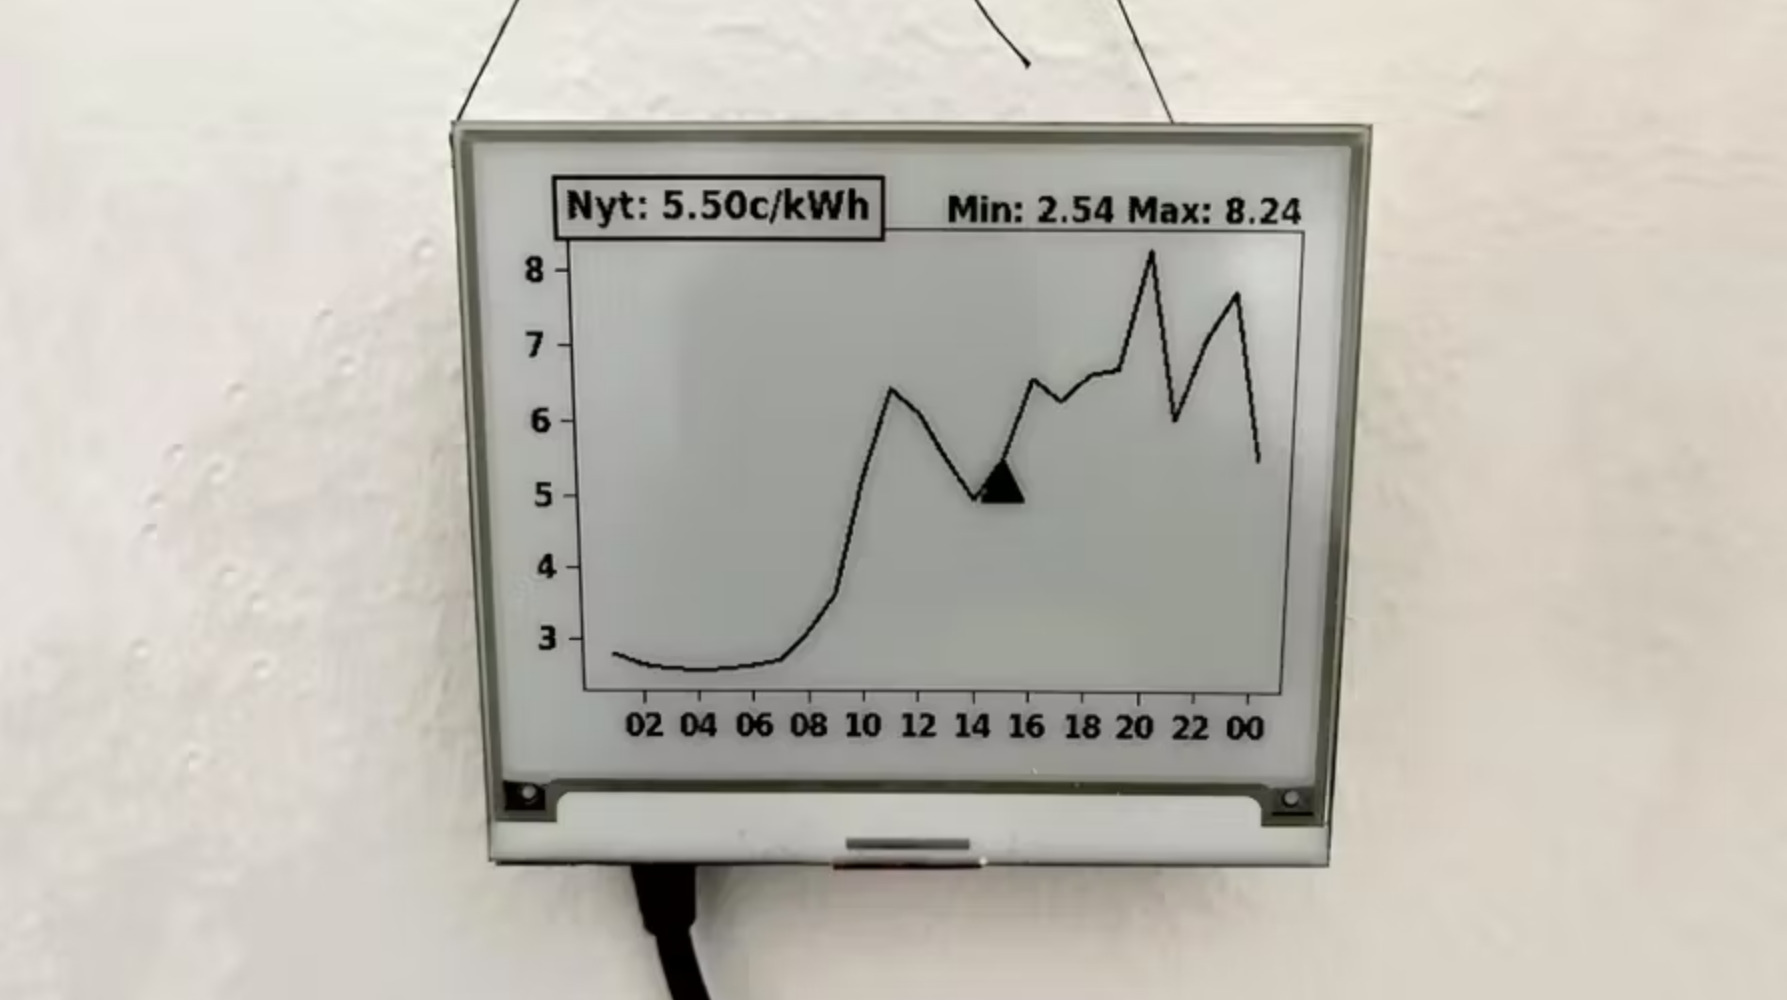
This E Ink device will let you keep a tab on power consumption in real-time
2023-03-09 / News / 14485 Sees / 0 CommentsIf rising power bills have been keeping you worried, here is a solution that might be of help to you. No, it isn’t about any alternate sources of energy. Rather, as Hackster.io described, it’s something that can help you maximize your savings by keeping a tab on electricity consumption so that you can plan using energy-intensive machines accordingly.
The device in question happens to be a continuous energy tracker that visually represents spot prices for energy and has been designed by a Finnish national by the name ‘fjorst’. The device is built around a Raspberry Pi 3 Model B single-board computer running Raspberry Pi OS, and a Python program that queries the Nord Pool API, a pan-European power exchange that allows energy providers in various countries to trade excess energy at wholesale prices.
“[I] made a quick electricity spot-price application to keep track on electricity prices during the day,” Fjorst explains. “This price does not include my provider margin — it’s the price from [the] Nord Pool API [Application Programming Interface.]”
The program graphs the current pricing on a Pimoroni Inky WHAT e-paper display, which uses minimal power consumption as it only requires power when the graph is being updated. The Python program could also be modified to incorporate past consumption data or aggregate hourly averages per day if an electricity provider has an API for such information. More information about the project is available on Fjorst’s Reddit post, and the source code has been published to GitHub under an unspecified open-source license.
More about“eink,eink display,EPIA,”'s article.
The original address《This E Ink device will let you keep a tab on power consumption in real-time》
